Test models · T20I models
Results through 2026-10-25. These ratings use 3377 completed ODI matches from 2000 onward. Stan, GAM, Glicko-2, and TrueSkill each estimate national-team strength under different assumptions. Each has its own scale: compare teams within a model.
The weekly update fits these methods to all eligible completed matches through its cutoff. Historical forecast evaluation is separate. These methods remain experimental; their availability is not evidence that one predicts better than the others. See the Elo ratings for this format.
Download all current ratings · Fit metadata · Methods and reproduction
60 matches have venue-country values supplied by verified location mappings. All eligible matches are retained. Download the venue audit.
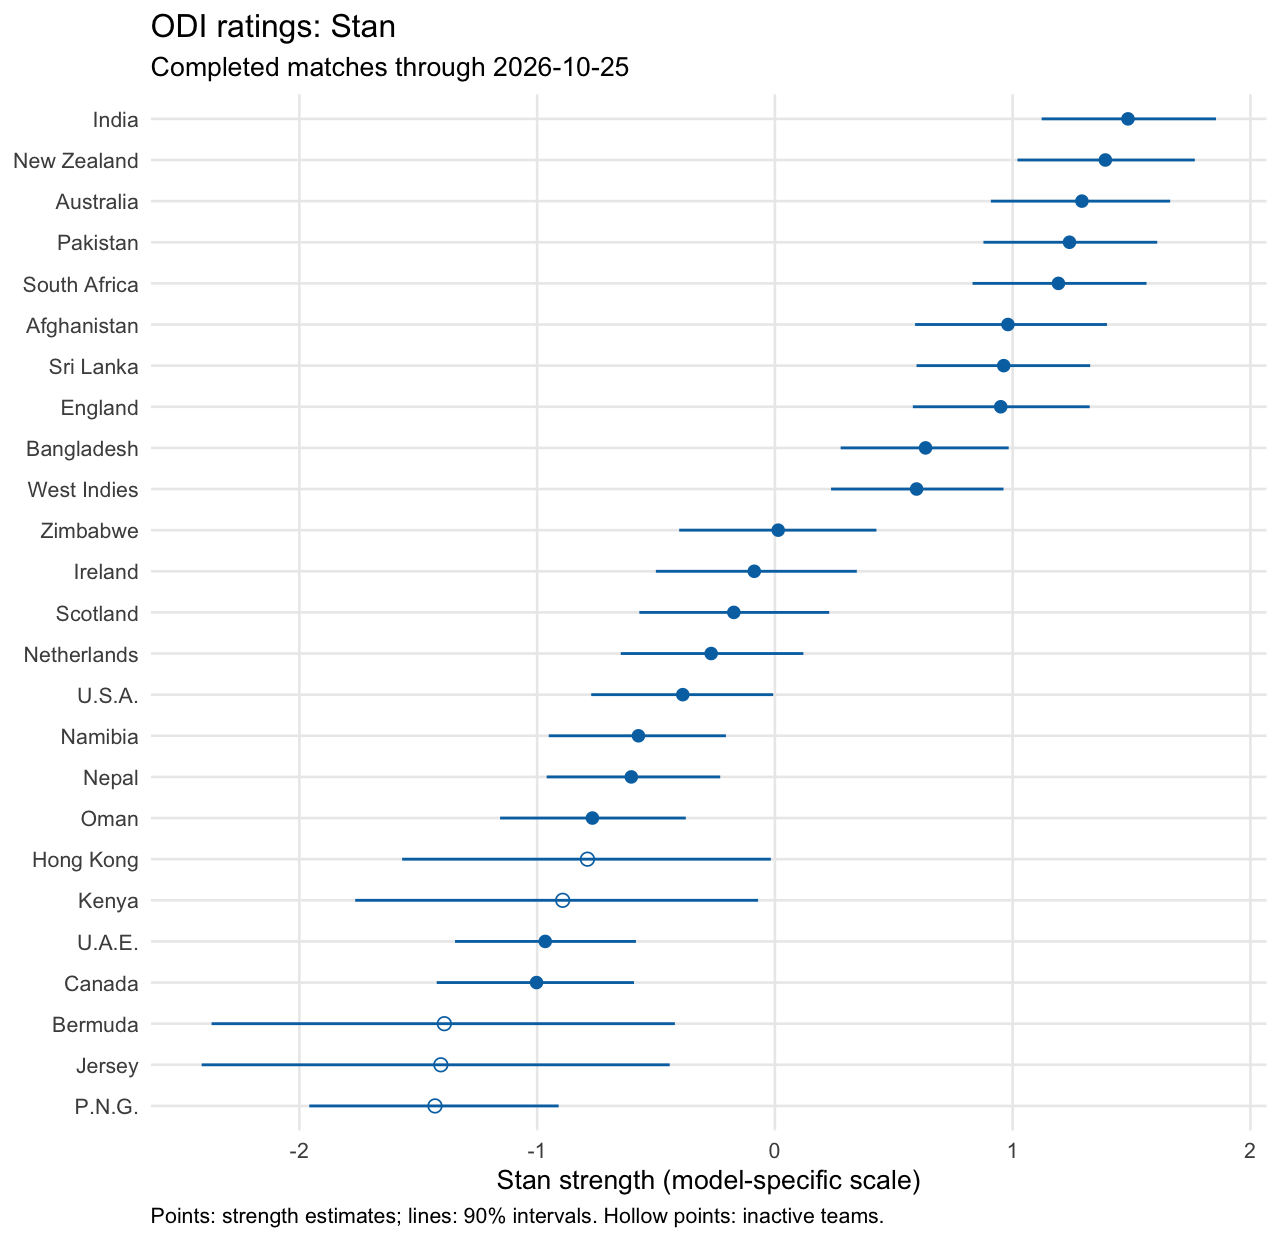
Stan
The dynamic probit model allows strength to change quarterly and models home advantage and draws using country and ground context. Estimates are posterior means with 90% credible intervals. The current quarter’s estimate uses completed matches through the cutoff, including matches later than the quarter’s start.
| 1 |
India |
1.49 |
1.12 to 1.86 |
2026-10-03 |
| 2 |
New Zealand |
1.39 |
1.02 to 1.77 |
2026-07-21 |
| 3 |
Australia |
1.29 |
0.91 to 1.66 |
2026-09-30 |
| 4 |
Pakistan |
1.24 |
0.88 to 1.61 |
2026-10-25 |
| 5 |
South Africa |
1.19 |
0.83 to 1.56 |
2026-09-30 |
| 6 |
Afghanistan |
0.98 |
0.59 to 1.40 |
2026-10-23 |
| 7 |
Sri Lanka |
0.96 |
0.60 to 1.33 |
2026-10-22 |
| 8 |
England |
0.95 |
0.58 to 1.32 |
2026-10-25 |
| 9 |
Bangladesh |
0.63 |
0.28 to 0.98 |
2026-10-21 |
| 10 |
West Indies |
0.60 |
0.24 to 0.96 |
2026-10-03 |
| 11 |
Zimbabwe |
0.01 |
-0.40 to 0.43 |
2026-10-23 |
| 12 |
Ireland |
-0.09 |
-0.50 to 0.34 |
2026-10-24 |
| 13 |
Scotland |
-0.17 |
-0.57 to 0.23 |
2026-08-13 |
| 14 |
Netherlands |
-0.27 |
-0.65 to 0.12 |
2026-10-25 |
| 15 |
U.S.A. |
-0.39 |
-0.77 to -0.01 |
2026-10-13 |
| 16 |
Namibia |
-0.57 |
-0.95 to -0.21 |
2026-10-24 |
| 17 |
Nepal |
-0.60 |
-0.96 to -0.23 |
2026-10-19 |
| 18 |
Oman |
-0.77 |
-1.16 to -0.37 |
2026-10-19 |
| 19 |
U.A.E. |
-0.97 |
-1.35 to -0.58 |
2026-10-25 |
| 20 |
Canada |
-1.00 |
-1.42 to -0.59 |
2026-10-17 |
| Inactive |
Hong Kong |
-0.79 |
-1.57 to -0.02 |
2018-09-18 |
| Inactive |
Kenya |
-0.89 |
-1.77 to -0.07 |
2014-01-30 |
| Inactive |
Bermuda |
-1.39 |
-2.37 to -0.42 |
2009-04-08 |
| Inactive |
Jersey (provisional) |
-1.41 |
-2.41 to -0.44 |
2023-04-05 |
| Inactive |
P.N.G. |
-1.43 |
-1.96 to -0.91 |
2023-04-05 |
Sampler diagnostics
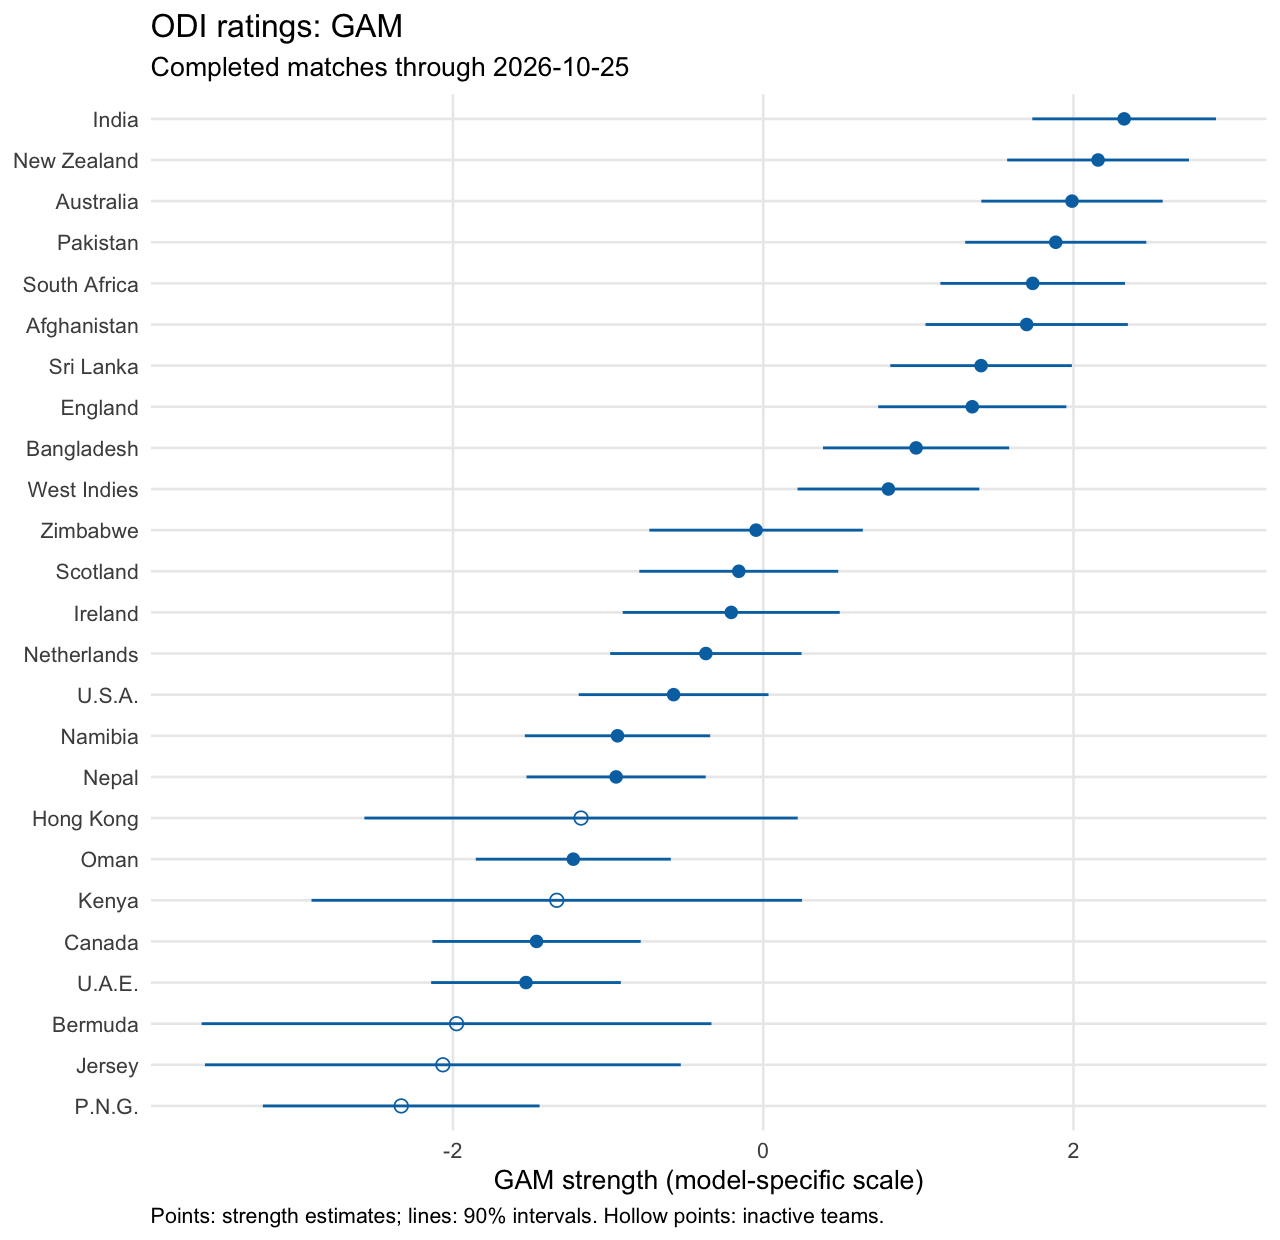
GAM
Penalized splines estimate smooth team trajectories, with country and ground variation in home advantage. Current strengths use the fitted endpoint, with approximate 90% intervals that include smoothing uncertainty.
| 1 |
India |
2.33 |
1.73 to 2.92 |
2026-10-03 |
| 2 |
New Zealand |
2.16 |
1.57 to 2.74 |
2026-07-21 |
| 3 |
Australia |
1.99 |
1.41 to 2.57 |
2026-09-30 |
| 4 |
Pakistan |
1.89 |
1.30 to 2.47 |
2026-10-25 |
| 5 |
South Africa |
1.74 |
1.14 to 2.33 |
2026-09-30 |
| 6 |
Afghanistan |
1.70 |
1.05 to 2.35 |
2026-10-23 |
| 7 |
Sri Lanka |
1.40 |
0.82 to 1.99 |
2026-10-22 |
| 8 |
England |
1.35 |
0.74 to 1.95 |
2026-10-25 |
| 9 |
Bangladesh |
0.99 |
0.39 to 1.59 |
2026-10-21 |
| 10 |
West Indies |
0.81 |
0.22 to 1.39 |
2026-10-03 |
| 11 |
Zimbabwe |
-0.05 |
-0.73 to 0.64 |
2026-10-23 |
| 12 |
Scotland |
-0.16 |
-0.80 to 0.48 |
2026-08-13 |
| 13 |
Ireland |
-0.21 |
-0.91 to 0.49 |
2026-10-24 |
| 14 |
Netherlands |
-0.37 |
-0.99 to 0.25 |
2026-10-25 |
| 15 |
U.S.A. |
-0.58 |
-1.19 to 0.03 |
2026-10-13 |
| 16 |
Namibia |
-0.94 |
-1.54 to -0.34 |
2026-10-24 |
| 17 |
Nepal |
-0.95 |
-1.53 to -0.37 |
2026-10-19 |
| 18 |
Oman |
-1.22 |
-1.85 to -0.60 |
2026-10-19 |
| 19 |
Canada |
-1.46 |
-2.13 to -0.79 |
2026-10-17 |
| 20 |
U.A.E. |
-1.53 |
-2.14 to -0.92 |
2026-10-25 |
| Inactive |
Hong Kong |
-1.17 |
-2.57 to 0.22 |
2018-09-18 |
| Inactive |
Kenya |
-1.33 |
-2.91 to 0.25 |
2014-01-30 |
| Inactive |
Bermuda |
-1.98 |
-3.62 to -0.33 |
2009-04-08 |
| Inactive |
Jersey (provisional) |
-2.06 |
-3.60 to -0.53 |
2023-04-05 |
| Inactive |
P.N.G. |
-2.33 |
-3.23 to -1.44 |
2023-04-05 |
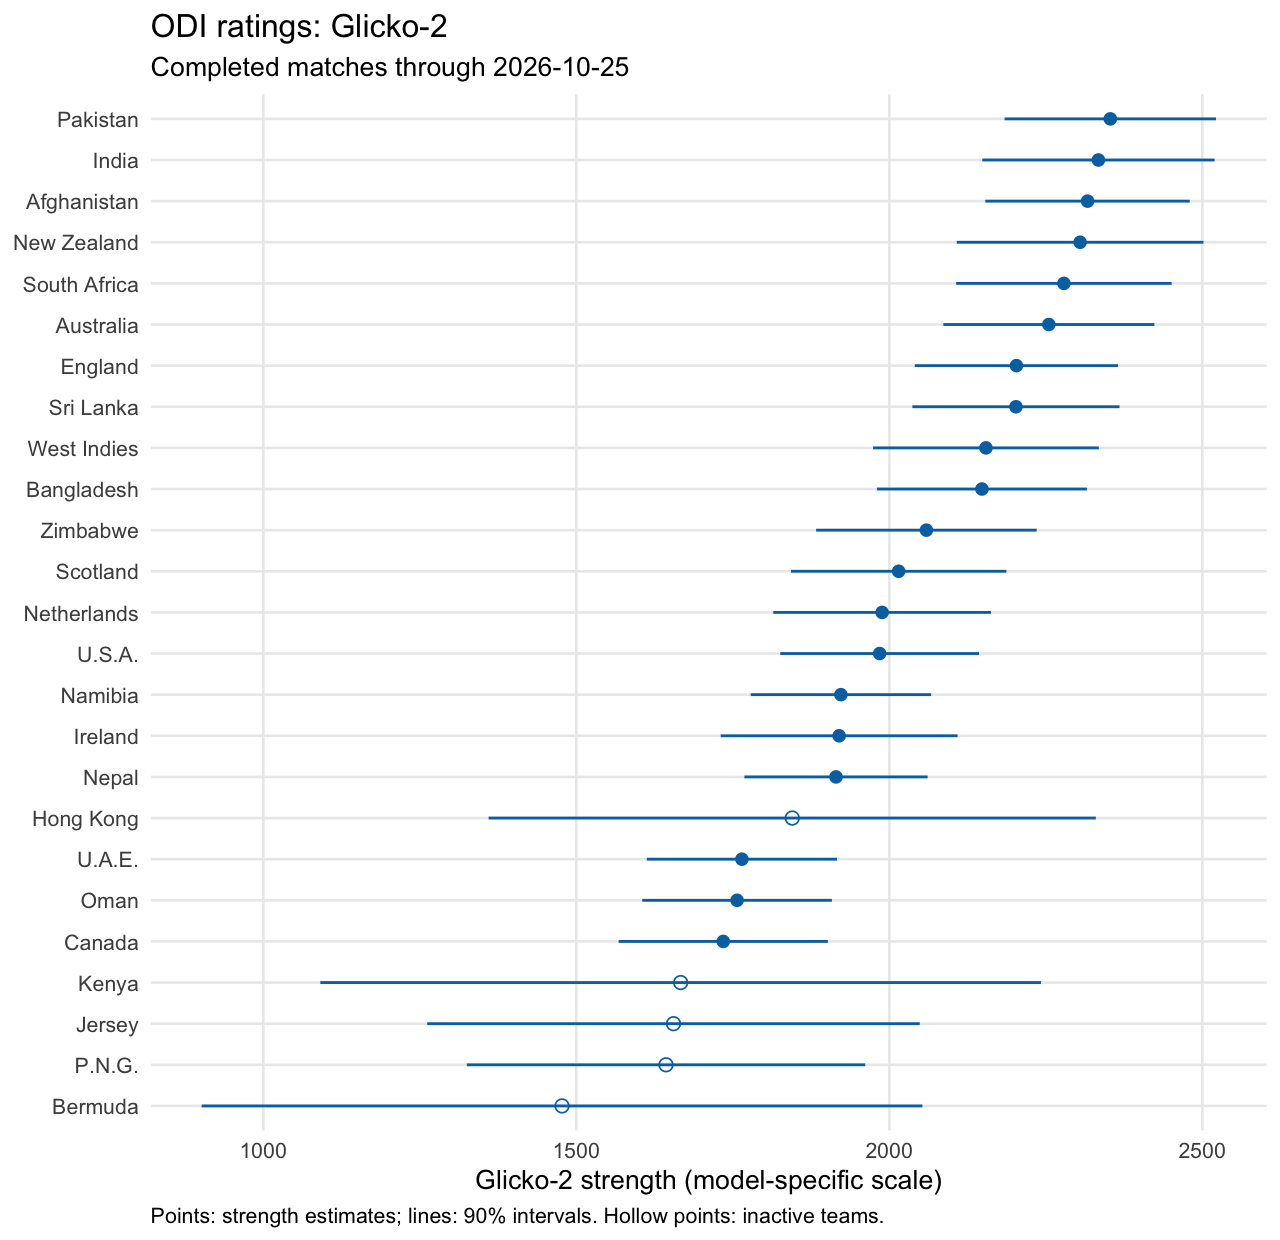
Glicko-2
Glicko-2 tracks ratings, rating deviations, and volatility using monthly periods. The current month is partial. Inactive teams retain their estimates but gain uncertainty over empty periods. Displayed intervals are approximate normal 90% intervals based on the rating deviation. This model has no venue adjustment.
| 1 |
Pakistan |
2353.02 |
2184.17 to 2521.87 |
2026-10-25 |
| 2 |
India |
2334.00 |
2148.46 to 2519.55 |
2026-10-03 |
| 3 |
Afghanistan |
2316.69 |
2153.37 to 2480.00 |
2026-10-23 |
| 4 |
New Zealand |
2304.76 |
2107.69 to 2501.83 |
2026-07-21 |
| 5 |
South Africa |
2278.91 |
2106.76 to 2451.06 |
2026-09-30 |
| 6 |
Australia |
2254.83 |
2086.27 to 2423.39 |
2026-09-30 |
| 7 |
England |
2203.03 |
2040.72 to 2365.35 |
2026-10-25 |
| 8 |
Sri Lanka |
2202.28 |
2036.87 to 2367.69 |
2026-10-22 |
| 9 |
West Indies |
2154.33 |
1974.01 to 2334.66 |
2026-10-03 |
| 10 |
Bangladesh |
2147.96 |
1980.21 to 2315.71 |
2026-10-21 |
| 11 |
Zimbabwe |
2059.21 |
1883.01 to 2235.41 |
2026-10-23 |
| 12 |
Scotland |
2014.93 |
1842.89 to 2186.96 |
2026-08-13 |
| 13 |
Netherlands |
1988.50 |
1814.63 to 2162.38 |
2026-10-25 |
| 14 |
U.S.A. |
1984.55 |
1825.75 to 2143.35 |
2026-10-13 |
| 15 |
Namibia |
1922.67 |
1778.59 to 2066.75 |
2026-10-24 |
| 16 |
Ireland |
1919.82 |
1730.63 to 2109.01 |
2026-10-24 |
| 17 |
Nepal |
1914.84 |
1768.49 to 2061.19 |
2026-10-19 |
| 18 |
U.A.E. |
1764.51 |
1612.54 to 1916.48 |
2026-10-25 |
| 19 |
Oman |
1756.79 |
1605.29 to 1908.29 |
2026-10-19 |
| 20 |
Canada |
1734.71 |
1567.56 to 1901.87 |
2026-10-17 |
| Inactive |
Hong Kong |
1844.91 |
1359.89 to 2329.93 |
2018-09-18 |
| Inactive |
Kenya |
1666.70 |
1091.00 to 2242.40 |
2014-01-30 |
| Inactive |
Jersey (provisional) |
1655.23 |
1261.81 to 2048.65 |
2023-04-05 |
| Inactive |
P.N.G. |
1643.27 |
1325.05 to 1961.49 |
2023-04-05 |
| Inactive |
Bermuda |
1477.16 |
901.46 to 2052.86 |
2009-04-08 |
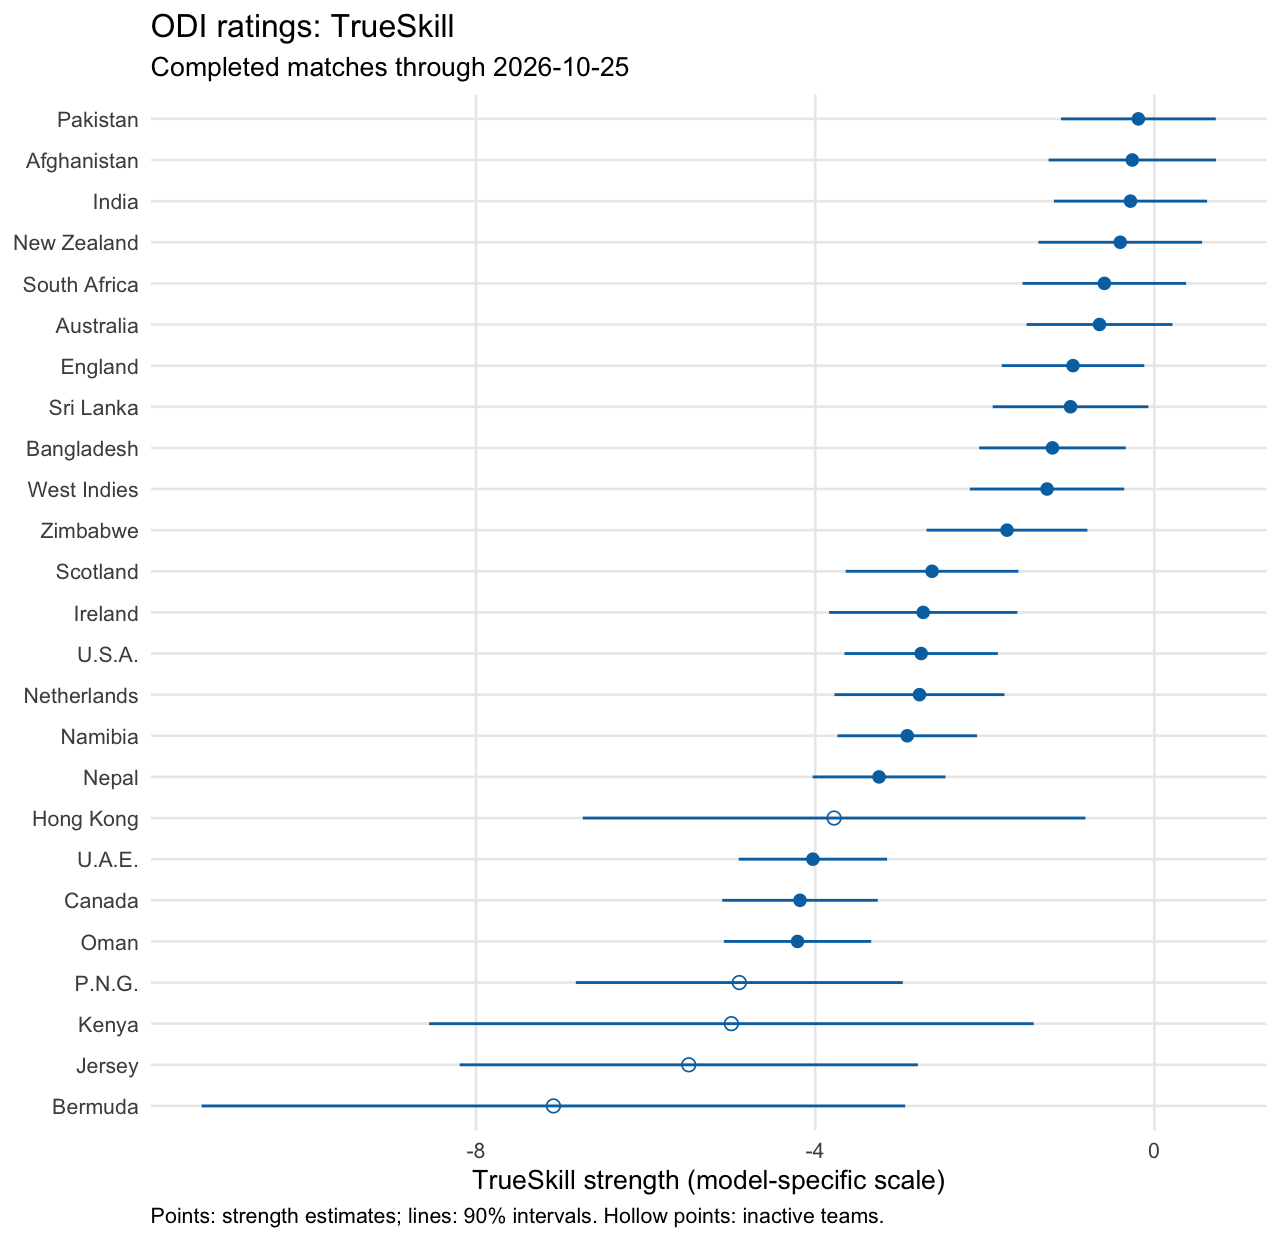
TrueSkill
TrueSkill updates Gaussian skill estimates as results arrive. We use forward filtering from the R package TrueSkillThroughTime, without its backward smoothing step. Calendar days govern uncertainty growth; draws and ties share a draw outcome. Displayed intervals are approximate Gaussian 90% intervals. This is a team model without venue effects, distinct from the contextual Stan model.
| 1 |
Pakistan |
-0.19 |
-1.10 to 0.72 |
2026-10-25 |
| 2 |
Afghanistan |
-0.26 |
-1.25 to 0.73 |
2026-10-23 |
| 3 |
India |
-0.28 |
-1.18 to 0.62 |
2026-10-03 |
| 4 |
New Zealand |
-0.40 |
-1.37 to 0.56 |
2026-07-21 |
| 5 |
South Africa |
-0.59 |
-1.55 to 0.37 |
2026-09-30 |
| 6 |
Australia |
-0.65 |
-1.51 to 0.21 |
2026-09-30 |
| 7 |
England |
-0.96 |
-1.80 to -0.12 |
2026-10-25 |
| 8 |
Sri Lanka |
-0.99 |
-1.91 to -0.07 |
2026-10-22 |
| 9 |
Bangladesh |
-1.20 |
-2.07 to -0.34 |
2026-10-21 |
| 10 |
West Indies |
-1.27 |
-2.18 to -0.36 |
2026-10-03 |
| 11 |
Zimbabwe |
-1.74 |
-2.69 to -0.79 |
2026-10-23 |
| 12 |
Scotland |
-2.62 |
-3.64 to -1.60 |
2026-08-13 |
| 13 |
Ireland |
-2.73 |
-3.84 to -1.62 |
2026-10-24 |
| 14 |
U.S.A. |
-2.75 |
-3.65 to -1.85 |
2026-10-13 |
| 15 |
Netherlands |
-2.77 |
-3.77 to -1.77 |
2026-10-25 |
| 16 |
Namibia |
-2.91 |
-3.74 to -2.09 |
2026-10-24 |
| 17 |
Nepal |
-3.25 |
-4.03 to -2.46 |
2026-10-19 |
| 18 |
U.A.E. |
-4.03 |
-4.90 to -3.15 |
2026-10-25 |
| 19 |
Canada |
-4.18 |
-5.10 to -3.26 |
2026-10-17 |
| 20 |
Oman |
-4.21 |
-5.08 to -3.34 |
2026-10-19 |
| Inactive |
Hong Kong |
-3.78 |
-6.74 to -0.81 |
2018-09-18 |
| Inactive |
P.N.G. |
-4.90 |
-6.82 to -2.97 |
2023-04-05 |
| Inactive |
Kenya |
-4.99 |
-8.55 to -1.42 |
2014-01-30 |
| Inactive |
Jersey (provisional) |
-5.49 |
-8.19 to -2.79 |
2023-04-05 |
| Inactive |
Bermuda |
-7.09 |
-11.24 to -2.94 |
2009-04-08 |
Reading the tables
Ranks order point estimates among teams with a rated match in the preceding 730 days. Fewer than ten matches is provisional. Intervals describe strength uncertainty under each model, not uncertainty about a match result or a team’s rank. A numerical rank difference can coexist with substantial uncertainty.
Download GAM and Stan histories. These histories use the full fitted sample and are retrospective estimates, not archived forecasts. Current ratings and the older evaluation have separate cutoffs and files.